
Built and deployed a predictive model for the Kaggle competition NYC Taxi Trip Duration. Performed feature engineering on geospatial and temporal data, applied advanced regression techniques, and optimized the model for improved accuracy. The project demonstrates skills in data preprocessing, feature engineering, model building, and evaluation.
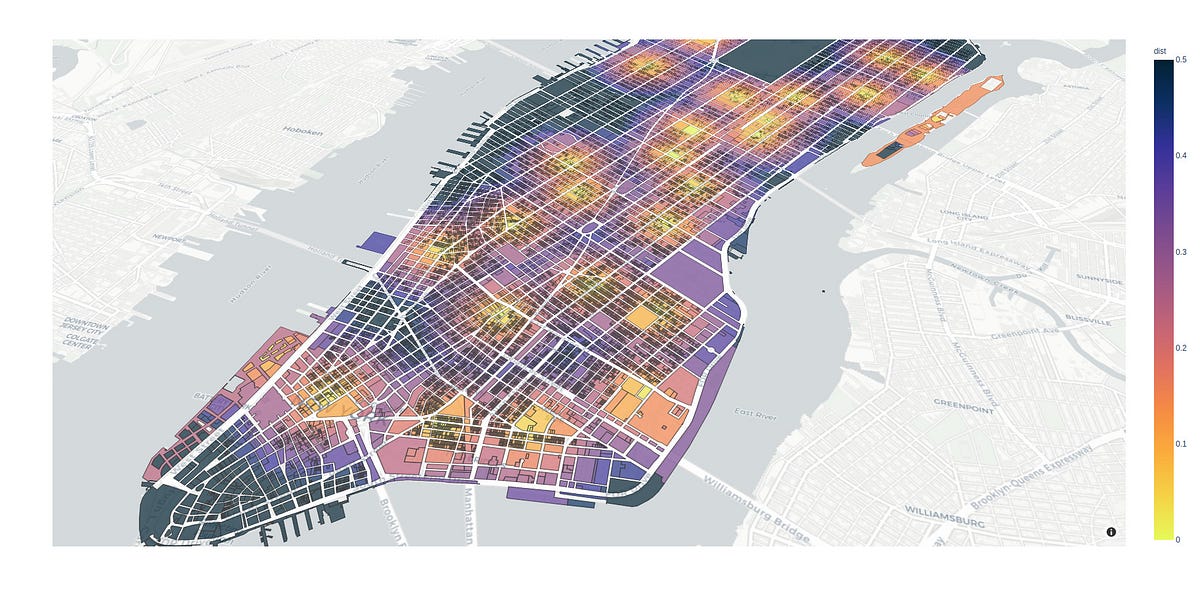
Interactive Tableau dashboards to explore the NYC Taxi Trip Duration dataset. The visualizations highlight trip patterns by time of day, day of week, passenger count, and pickup/drop-off locations, enabling deeper insights into factors influencing trip duration. This exploratory analysis provided a strong foundation for feature engineering and predictive modeling.
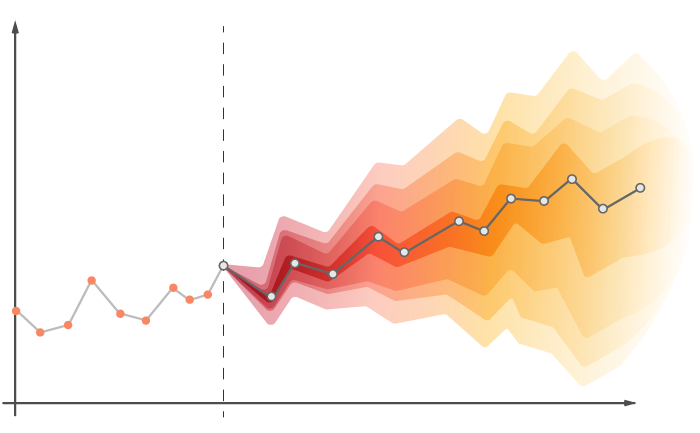
Engineered and preprocessed a large-scale retail dataset from the Store Sales Time Series Forecasting competition on Kaggle. The focus was on transforming raw sales data into a structured format suitable for predictive modeling, handling missing values, feature engineering, and temporal aggregation. Developed and submitted sales forecasts, achieving competitive predictions.
Interactive Tableau dashboards to explore and visualize the Store Sales Time Series Forecasting. The visualizations allow dynamic exploration of sales trends across stores, products, and time periods, uncovering patterns, seasonality, and anomalies in the data, transforming complex datasets into actionable insights through intuitive dashboards.
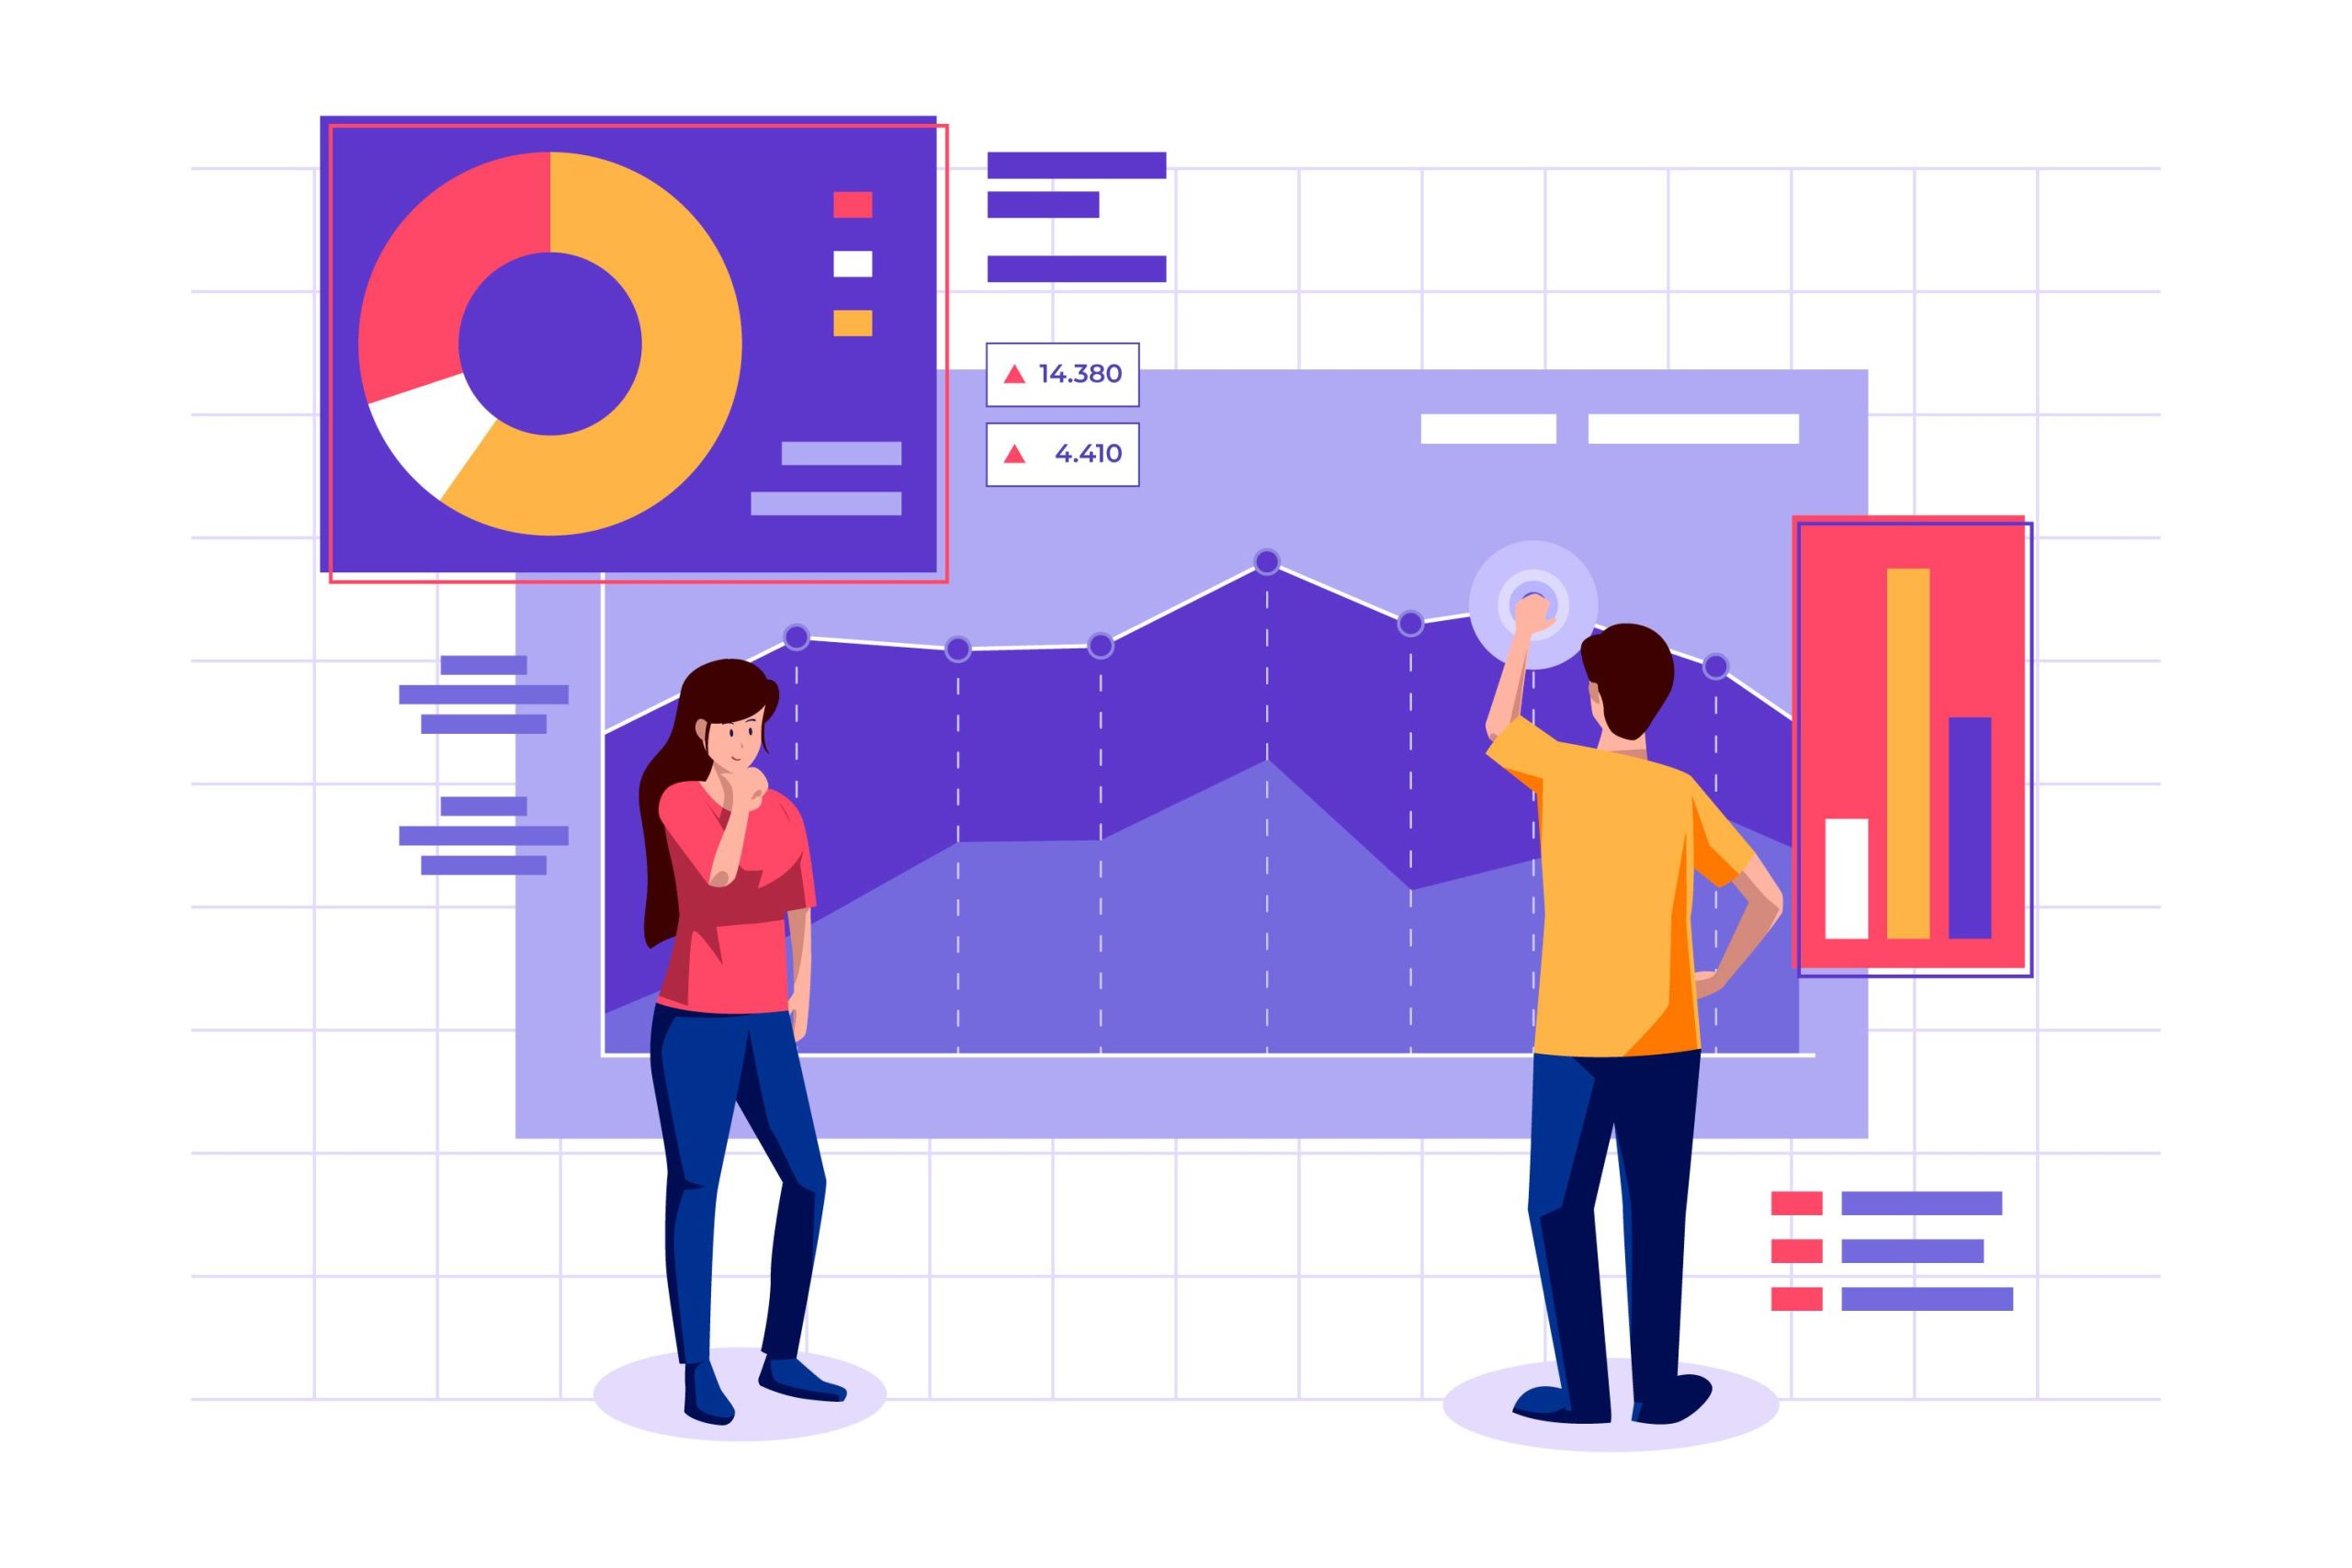
Provides a comprehensive understanding of the long-term value of customers to a business. Knowing the Customer Lifetime Value (CLV) allows marketers to segment their audience more accurately and target customers with the highest potential value. This insight enables marketers to segment their audience, identifying high-value customers who contribute significantly to revenue over time.

A centralized and user-friendly interface to provide a real- or near real-time look at on-the-ground metrics to help businesses track how effectively they are meeting their goals.
The dashboard consolidates critical data points such as Sales, Profit, and Orders into a single, easy-to-navigate view, allowing stakeholders to monitor performance at a glance.
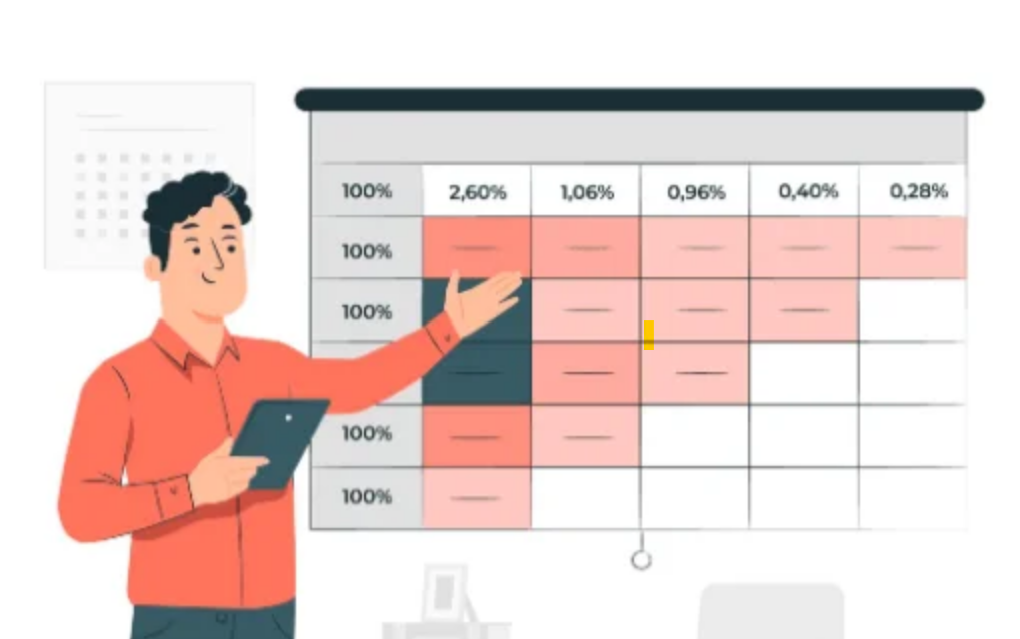
Python + ML + NLP
Explores how machine learning can transform raw customer feedback into actionable insights
through text preprocessing, removing noise, eliminating stopwords, and applying stemming, to clean the data for analysis.
A Logistic Regression model, combined with TF-IDF vectorization, is used to analyze patterns in the text.